Grundlæggende statistik
| Institutionelle ejere | 465 total, 438 long only, 6 short only, 21 long/short - change of 2,00% MRQ |
| Gennemsnitlig porteføljeallokering | 0.7054 % - change of 25,92% MRQ |
| Institutionelle aktier (lange) | 527.054.703 (ex 13D/G) - change of -47,01MM shares -5,64% MRQ |
| Institutionel værdi (lang) | $ 8.443.645 USD ($1000) |
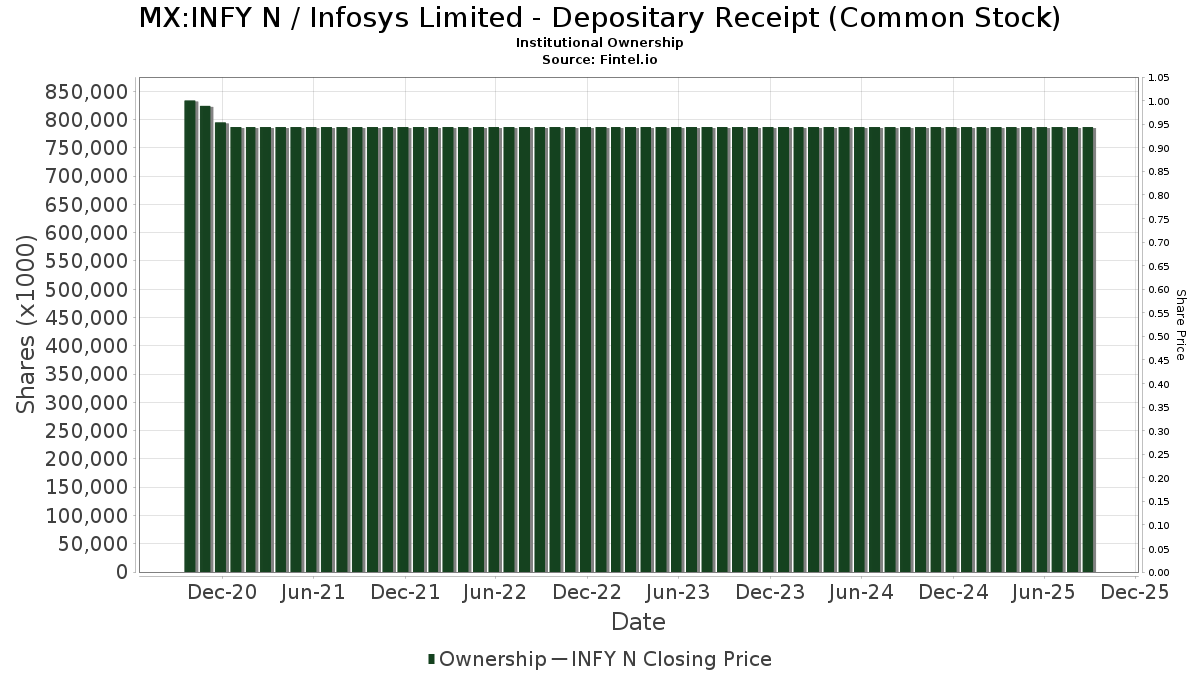
Institutionelt ejerskab og aktionærer
Infosys Limited - Depositary Receipt (Common Stock) (MX:INFY N) har 465 institutionelle ejere og aktionærer, der har indsendt 13D/G- eller 13F-formularer til Securities Exchange Commission (SEC). Disse institutioner har i alt 527,054,703 aktier. Største aktionærer omfatter First Trust Advisors Lp, Morgan Stanley, Robeco Institutional Asset Management B.V., Jpmorgan Chase & Co, GQG Partners LLC, Acadian Asset Management Llc, Lazard Asset Management Llc, UBS Group AG, State Street Corp, and Trinity Street Asset Management LLP .
Infosys Limited - Depositary Receipt (Common Stock) (BMV:INFY N) institutionel ejerskabsstruktur viser aktuelle positioner i virksomheden efter institutioner og fonde, samt seneste ændringer i positionsstørrelse. Større aktionærer kan omfatte individuelle investorer, investeringsforeninger, hedgefonde eller institutioner. Skema 13D angiver, at investoren besidder (eller besidder) mere end 5 % af virksomheden og har til hensigt (eller har til hensigt at) aktivt at forfølge en ændring i forretningsstrategi. Skema 13G indikerer en passiv investering på over 5%.
Fondens stemningsscore
Fund Sentiment Score (fka Ownership Accumulation Score) finder de aktier, der bliver mest købt af fonde. Det er resultatet af en sofistikeret, multi-faktor kvantitativ model, der identificerer virksomheder med de højeste niveauer af institutionel akkumulering. Scoringsmodellen bruger en kombination af den samlede stigning i oplyste ejere, ændringerne i porteføljeallokeringer i disse ejere og andre målinger. Tallet går fra 0 til 100, hvor højere tal indikerer et højere niveau af akkumulering for sine jævnaldrende, og 50 er gennemsnittet.
Opdateringsfrekvens: Dagligt
Se Ownership Explorer, som giver en liste over højest rangerende virksomheder.
AI+ Ask Fintel’s AI assistant about Infosys Limited - Depositary Receipt (Common Stock).
Select a question to share a public post with an AI-crafted answer.
Thinking of good questions…
13F og NPORT arkivering
Detaljer om 13F-arkivering er gratis. Detaljer om NP-ansøgninger kræver et premium-medlemskab. Grønne rækker angiver nye positioner. Røde rækker angiver lukkede positioner. Klik på linket ikon for at se den fulde transaktionshistorik.
Opgrader
for at låse premium-data op og eksportere til Excel ![]() .
.
| Fil dato | Kilde | Investor | Type | Gennemsnitlig pris (Øst) |
Aktier | Δ Aktier (%) |
Rapporteret Værdi ($1000) |
Δ Værdi (%) |
Port Alloc (%) |
|
|---|---|---|---|---|---|---|---|---|---|---|
| 2026-04-15 | 13F | Merit Financial Group, LLC | 35.025 | 1,50 | 473 | -22,96 | ||||
| 2026-02-09 | 13F | Hartland & Co., LLC | 810 | 1,25 | 14 | 7,69 | ||||
| 2026-02-03 | 13F | Sageworth Trust Co | 0 | -100,00 | 0 | |||||
| 2026-02-18 | 13F | EP Wealth Advisors, Inc. | 11.016 | 196 | ||||||
| 2026-02-11 | 13F | Cerity Partners LLC | 193.991 | 26,01 | 3.457 | 38,02 | ||||
| 2026-02-09 | 13F | Mondrian Investment Partners LTD | 4.736.853 | -3,49 | 84.411 | 5,70 | ||||
| 2026-02-17 | 13F | Summit Global Investments | 162.959 | 3 | ||||||
| 2026-02-17 | 13F | Millennium Management Llc | 410.677 | -95,76 | 7.318 | -95,36 | ||||
| 2026-02-13 | 13F | Cozad Asset Management Inc | 14.065 | 0,00 | 251 | 9,65 | ||||
| 2026-02-17 | 13F | Millennium Management Llc | Put | 15.000 | 0,00 | 267 | 9,43 | |||
| 2026-02-17 | 13F | Toronto Dominion Bank | 250.004 | -50,00 | 4.455 | -45,24 | ||||
| 2026-02-12 | 13F | Aviva Plc | 108.732 | -0,76 | 1.938 | 8,70 | ||||
| 2026-03-02 | 13F | Reflection Asset Management | 1.441 | 26 | ||||||
| 2025-11-14 | 13F | Flow Traders U.s. Llc | 0 | -100,00 | 0 | |||||
| 2026-02-12 | 13F | BRYN MAWR TRUST Co | 100 | 0,00 | 2 | 0,00 | ||||
| 2026-02-12 | 13F | Grey Fox Wealth Advisors, LLC | 0 | -100,00 | 0 | |||||
| 2026-04-23 | 13F | Rexford Capital Inc | 1.500 | 0,00 | 20 | -23,08 | ||||
| 2026-02-17 | 13F | DZ BANK AG Deutsche Zentral Genossenschafts Bank, Frankfurt am Main | 766.500 | 1,54 | 13.659 | 11,21 | ||||
| 2026-04-23 | 13F | Farmers & Merchants Trust Co of Chambersburg PA | 700 | 0,00 | 0 | |||||
| 2026-02-17 | 13F | Tcw Group Inc | 28.570 | 0,00 | 509 | 9,70 | ||||
| 2026-04-15 | 13F | Birch Capital Management, LLC | 262.702 | -1,07 | 3.549 | -24,98 | ||||
| 2026-02-10 | 13F | Goldman Sachs Group Inc | Call | 0 | -100,00 | 0 | -100,00 | |||
| 2026-02-17 | 13F | Pinnacle Financial Partners, Inc. | 13.797 | 246 | ||||||
| 2025-11-10 | 13F | Beverly Hills Private Wealth, LLC | 0 | -100,00 | 0 | |||||
| 2026-01-12 | 13F | Daymark Wealth Partners, Llc | 12.800 | 0,00 | 228 | 9,62 | ||||
| 2026-02-06 | 13F | Leonteq Securities AG | 133.749 | -55,57 | 2.383 | -51,35 | ||||
| 2026-02-13 | 13F | Parkside Financial Bank & Trust | 811 | 0,00 | 14 | 7,69 | ||||
| 2026-02-13 | 13F | BNP Paribas Asset Management Holding S.A. | 562.459 | 15 | ||||||
| 2026-02-13 | 13F | NLB Skladi, upravljanje premozenja, d.o.o. | 384.681 | 6.855 | ||||||
| 2026-02-12 | 13F | Haven Private, LLC | 50.197 | -3,07 | 895 | 6,18 | ||||
| 2026-02-13 | 13F | Causeway Capital Management Llc | 2.482.318 | 774,28 | 44.235 | 857,65 | ||||
| 2026-02-17 | 13F | Caption Management, LLC | 0 | -100,00 | 0 | |||||
| 2026-02-13 | 13F | First Trust Advisors Lp | 58.456.448 | -1,47 | 1.041.694 | 7,92 | ||||
| 2026-04-14 | 13F | Perpetual Ltd | 1.165.189 | 6,28 | 15.742 | -19,42 | ||||
| 2026-02-12 | 13F | Brown Brothers Harriman & Co | 9.398 | -8,58 | 167 | 0,00 | ||||
| 2025-11-14 | 13F | Strategic Wealth Partners, Ltd. | 403 | 0,00 | 7 | -14,29 | ||||
| 2026-04-20 | 13F | Kestra Private Wealth Services, Llc | 41.526 | -2,72 | 561 | -26,18 | ||||
| 2026-02-12 | 13F | Sustainable Insight Capital Management, LLC | 13.835 | 20,99 | 247 | 32,26 | ||||
| 2026-04-16 | 13F | Quotient Wealth Partners, LLC | 11.693 | 158 | ||||||
| 2026-01-26 | 13F | KBC Group NV | 171.119 | 28,24 | 3 | 50,00 | ||||
| 2026-04-10 | 13F | Centurion Wealth Management LLC | 13.000 | 0,00 | 176 | -24,24 | ||||
| 2026-01-30 | 13F/A | M&t Bank Corp | 97.573 | 1.739 | ||||||
| 2026-02-10 | 13F | Guardcap Asset Management Ltd | 105.600 | -15,11 | 1.882 | -7,02 | ||||
| 2026-02-19 | 13F | CI Private Wealth, LLC | 154.678 | -0,27 | 2.739 | 8,56 | ||||
| 2026-02-05 | 13F | Allworth Financial LP | 5.735 | 18,03 | 102 | 29,11 | ||||
| 2026-02-18 | 13F | GWM Advisors LLC | 2.264 | -95,43 | 40 | -95,04 | ||||
| 2026-04-24 | 13F | Strs Ohio | 147.000 | 0,00 | 1.986 | -24,21 | ||||
| 2025-11-07 | 13F | Atticus Wealth Management, Llc | 0 | -100,00 | 0 | |||||
| 2026-02-12 | 13F | Comgest Global Investors S.a.s. | 0 | -100,00 | 0 | |||||
| 2026-04-10 | 13F | Naviter Wealth, LLC | 72.410 | -0,92 | 978 | -24,88 | ||||
| 2026-02-13 | 13F | Macquarie Group Ltd | 0 | -100,00 | 0 | |||||
| 2026-04-20 | 13F | Banque Cantonale Vaudoise | 133.434 | -3,66 | 1.803 | -26,94 | ||||
| 2026-01-22 | 13F | Pinnacle Bancorp, Inc. | 0 | -100,00 | 0 | |||||
| 2026-04-21 | 13F | Financial Consulate, Inc | 707 | 644,21 | 10 | 800,00 | ||||
| 2026-02-17 | 13F | GAM Holding AG | 314.731 | -6,80 | 5.609 | 2,07 | ||||
| 2026-02-13 | 13F | Morgan Stanley | 50.927.556 | 34,19 | 907.529 | 46,97 | ||||
| 2026-02-17 | 13F | Mercer Global Advisors Inc /adv | 17.637 | -7,88 | 314 | 0,96 | ||||
| 2026-02-14 | 13F | Rockefeller Capital Management L.P. | 9.483 | 6,07 | 169 | 16,55 | ||||
| 2025-11-14 | 13F | Qube Research & Technologies Ltd | 0 | -100,00 | 0 | -100,00 | ||||
| 2026-02-17 | 13F | Oaktree Fund Advisors, LLC | 60.972 | 1.087 | ||||||
| 2026-01-27 | 13F | Evergreen Capital Management Llc | 67.747 | 36,75 | 1.207 | 49,75 | ||||
| 2026-02-10 | 13F | CIBC World Markets Inc. | 22.467 | 2,61 | 400 | 12,36 | ||||
| 2026-02-12 | 13F | Dimensional Fund Advisors Lp | 7.736.951 | 2,17 | 137.900 | 11,93 | ||||
| 2026-02-18 | 13F | First Citizens Bank & Trust Co | 30.142 | -1,18 | 537 | 8,27 | ||||
| 2026-02-02 | 13F | Principal Financial Group Inc | 141.125 | 0,00 | 2.515 | 9,49 | ||||
| 2026-02-05 | 13F | Tucker Asset Management Llc | 1.152 | 21 | ||||||
| 2026-02-12 | 13F | Skopos Labs, Inc. | 148.995 | 268,02 | 2.746 | 266,49 | ||||
| 2026-02-13 | 13F | Glen Eagle Advisors, LLC | 0 | -100,00 | 0 | |||||
| 2026-02-06 | 13F | Larson Financial Group LLC | 204 | 22,16 | 4 | 50,00 | ||||
| 2026-02-17 | 13F | Citadel Advisors Llc | 147.932 | -90,28 | 2.636 | -89,35 | ||||
| 2026-02-09 | 13F | Coldstream Capital Management Inc | 15.319 | -9,34 | 273 | -0,73 | ||||
| 2026-02-17 | 13F | Citadel Advisors Llc | Put | 442.400 | 108,88 | 7.884 | 128,82 | |||
| 2026-02-17 | 13F | Citadel Advisors Llc | Call | 312.700 | 18,00 | 5.572 | 29,25 | |||
| 2026-02-12 | 13F | Qtron Investments LLC | 0 | -100,00 | 0 | |||||
| 2025-11-14 | 13F | Wetherby Asset Management Inc | 208.099 | -4,35 | 3.386 | -16,03 | ||||
| 2025-10-27 | 13F | First Horizon Corp | 0 | -100,00 | 0 | |||||
| 2026-02-03 | 13F | Ballentine Partners, LLC | 99.635 | 3,07 | 1.775 | 12,91 | ||||
| 2026-02-06 | 13F | Harvest Portfolios Group Inc. | 20.091 | -12,21 | 358 | -3,76 | ||||
| 2026-02-09 | 13F | Fisher Asset Management, LLC | 0 | -100,00 | 0 | |||||
| 2026-02-10 | 13F | Sustainable Growth Advisers, LP | 350.187 | -96,78 | 6.240 | -96,48 | ||||
| 2026-04-21 | 13F | Vise Technologies, Inc. | 115.743 | 0,00 | 2.063 | 0,00 | ||||
| 2025-11-14 | 13F | Wexford Capital Lp | 0 | -100,00 | 0 | |||||
| 2026-02-12 | 13F | CIBC Private Wealth Group, LLC | 5.135 | 0,00 | 92 | 9,64 | ||||
| 2026-04-20 | 13F | White Oak Capital Partners Pte. Ltd. | 623.700 | -23,43 | 8.305 | -43,18 | ||||
| 2026-02-17 | 13F | Ancora Advisors, LLC | 4.600 | 0,00 | 82 | 9,46 | ||||
| 2026-04-16 | 13F | Diversified Trust Co | 13.330 | -92,18 | 180 | -94,07 | ||||
| 2026-02-13 | 13F | Walleye Capital LLC | Put | 53.800 | 138,05 | 959 | 161,04 | |||
| 2026-02-13 | 13F | Umb Bank N A/mo | 3.061 | 0,00 | 55 | 10,20 | ||||
| 2026-02-17 | 13F | Alliancebernstein L.p. | 52.536 | 218,75 | 936 | 249,25 | ||||
| 2026-02-13 | 13F | Walleye Capital LLC | 4 | 0 | ||||||
| 2026-02-13 | 13F | Walleye Capital LLC | Call | 84.600 | 438,85 | 1.508 | 490,98 | |||
| 2026-01-16 | 13F | Crowley Wealth Management, Inc. | 0 | -100,00 | 0 | |||||
| 2026-02-09 | 13F | Huntington National Bank | 607 | 10,97 | 11 | 25,00 | ||||
| 2026-02-02 | 13F | Aikya Investment Management Ltd | 483.104 | -14,51 | 8.609 | -6,37 | ||||
| 2026-04-16 | 13F | E. Ohman J:or Asset Management AB | 242.900 | -6,68 | 3.282 | -29,26 | ||||
| 2026-04-24 | 13F | Keybank National Association/oh | 15.175 | 205 | ||||||
| 2026-02-13 | 13F | Smartleaf Asset Management LLC | 1.278 | 1,83 | 23 | 15,00 | ||||
| 2026-02-17 | 13F | Two Sigma Advisers, Lp | 60.100 | -76,25 | 1.071 | -74,00 | ||||
| 2026-02-09 | 13F | Nicola Wealth Management Ltd. | 948.000 | 15,33 | 16.893 | 26,32 | ||||
| 2026-04-24 | 13F | Medallion Wealth Advisors, LLC | 1.110 | 0,00 | 15 | -26,32 | ||||
| 2025-11-06 | 13F | Wealthstream Advisors, Inc. | 13.055 | -4,16 | 212 | -15,87 | ||||
| 2026-04-02 | 13F | Ares Financial Consulting, LLC | 68 | 0,00 | 1 | -100,00 | ||||
| 2026-02-11 | 13F | Krane Funds Advisors LLC | 49.424 | 0,00 | 881 | 9,45 | ||||
| 2026-02-17 | 13F | Quantinno Capital Management LP | 270.646 | 50,45 | 4.823 | 64,80 | ||||
| 2026-02-17 | 13F | EFG International AG | 24.603 | 438 | ||||||
| 2026-02-13 | 13F | Kestra Advisory Services, LLC | 13.684 | 244 | ||||||
| 2026-02-17 | 13F | Parallax Volatility Advisers, L.P. | Put | 0 | -100,00 | 0 | ||||
| 2026-02-17 | 13F | Parallax Volatility Advisers, L.P. | 0 | -100,00 | 0 | |||||
| 2026-04-21 | 13F | Foster & Motley Inc | 158.188 | 0,05 | 2 | 0,00 | ||||
| 2026-02-10 | 13F | NS Partners Ltd | 769.900 | 13.720 | ||||||
| 2026-02-17 | 13F | Scientech Research LLC | 0 | -100,00 | 0 | |||||
| 2026-02-13 | 13F | MAI Capital Management | 27.454 | 0,00 | 489 | 9,64 | ||||
| 2026-04-10 | 13F | Marshall Financial Group LLC | 62.998 | -0,85 | 851 | -24,82 | ||||
| 2026-02-13 | 13F | Rhumbline Advisers | 528.717 | -2,83 | 9.422 | 6,42 | ||||
| 2026-02-13 | 13F | Mariner, LLC | 135.472 | 13,72 | 2.421 | 24,87 | ||||
| 2026-02-13 | 13F | Itau Unibanco Holding S.A. | 30.382 | 0,00 | 541 | 9,51 | ||||
| 2025-11-07 | 13F | Sierra Ocean, Llc | 0 | -100,00 | 0 | |||||
| 2026-04-10 | 13F | Henry James International Management Inc. | 87.621 | 1,68 | 1.184 | -22,93 | ||||
| 2026-01-29 | 13F | Sanctuary Advisors, LLC | 36.080 | 23,12 | 643 | 34,87 | ||||
| 2026-02-02 | 13F | Mutual Advisors, LLC | 16.725 | 58,95 | 298 | 61,96 | ||||
| 2026-02-17 | 13F | Ameriprise Financial Inc | 1.973.283 | -1,95 | 35.176 | 7,48 | ||||
| 2026-01-27 | 13F | TD Waterhouse Canada Inc. | 369 | -65,83 | 7 | -64,71 | ||||
| 2025-11-06 | 13F | Ameritas Advisory Services, LLC | 0 | -100,00 | 0 | -100,00 | ||||
| 2026-04-13 | 13F | Runnymede Capital Advisors, Inc. | 0 | -100,00 | 0 | |||||
| 2026-01-28 | 13F | Klp Kapitalforvaltning As | 54.800 | 552,38 | 977 | 617,65 | ||||
| 2026-02-11 | 13F | Prudential Plc | 149.000 | 0,00 | 2.655 | 9,53 | ||||
| 2026-02-11 | 13F | O'shaughnessy Asset Management, Llc | 374.187 | -0,44 | 6.668 | 9,04 | ||||
| 2026-02-11 | 13F | Mirae Asset Securities (usa) Inc. | Put | 476.392 | 2.147 | |||||
| 2026-02-17 | 13F | Delaware Management Holdings, Inc. | 757.029 | 13.490 | ||||||
| 2025-11-10 | 13F | D'Orazio & Associates, Inc. | 0 | -100,00 | 0 | -100,00 | ||||
| 2026-01-30 | 13F | R Squared Ltd | 35.025 | -65,70 | 624 | -62,43 | ||||
| 2026-01-30 | 13F | Flossbach Von Storch Ag | 0 | -100,00 | 0 | |||||
| 2026-04-07 | 13F | Signaturefd, Llc | 60.764 | -36,28 | 821 | -51,74 | ||||
| 2025-10-30 | 13F | CBOE Vest Financial, LLC | 0 | -100,00 | 0 | -100,00 | ||||
| 2026-02-17 | 13F | MIRAE ASSET GLOBAL ETFS HOLDINGS Ltd. | 148.882 | -4,26 | 2.653 | 4,86 | ||||
| 2026-02-04 | 13F | LRI Investments, LLC | 235 | 0,00 | 4 | 33,33 | ||||
| 2026-02-09 | 13F | Integrity Alliance, Llc. | 18.149 | 323 | ||||||
| 2026-02-12 | 13F | Jane Street Group, Llc | 302.318 | 250,65 | 5.387 | 284,24 | ||||
| 2026-02-12 | 13F | Federated Hermes, Inc. | 8.898 | -91,00 | 159 | -90,18 | ||||
| 2026-02-12 | 13F | Jane Street Group, Llc | Put | 612.200 | 86,08 | 10.909 | 103,83 | |||
| 2026-02-12 | 13F | Jane Street Group, Llc | Call | 100.600 | 3,29 | 1.793 | 13,13 | |||
| 2026-01-23 | 13F | LOM Asset Management Ltd | 1.000 | 0,00 | 18 | 6,25 | ||||
| 2026-01-29 | 13F | IMC-Chicago, LLC | Put | 138.600 | -45,88 | 2.470 | -40,73 | |||
| 2026-01-29 | 13F | IMC-Chicago, LLC | Call | 52.800 | -39,79 | 941 | -34,08 | |||
| 2025-11-07 | 13F | Synovus Financial Corp | 16.479 | -10,72 | 268 | -21,64 | ||||
| 2026-01-27 | 13F | WealthCollab, LLC | 3.239 | 4,55 | 58 | 14,00 | ||||
| 2026-04-17 | 13F | Brown, Lisle/cummings, Inc. | 109 | 1 | ||||||
| 2026-02-10 | 13F | Connor, Clark & Lunn Investment Management Ltd. | 2.670.531 | 182,63 | 47.589 | 209,56 | ||||
| 2026-04-13 | 13F | IFP Advisors, Inc | 188 | -30,88 | 3 | -50,00 | ||||
| 2026-02-17 | 13F | Schonfeld Strategic Advisors LLC | Call | 0 | -100,00 | 0 | ||||
| 2026-02-11 | 13F | Deutsche Bank Ag\ | 13.876.859 | -6,96 | 247.286 | 1,91 | ||||
| 2026-01-26 | 13F | Haven Global Partners, LLC | 306.827 | 69,57 | 5.468 | 85,70 | ||||
| 2026-02-17 | 13F | Palestra Capital Management LLC | 2.709.445 | 48.282 | ||||||
| 2026-02-17 | 13F | XTX Topco Ltd | 129.089 | 4,34 | 2.300 | 14,31 | ||||
| 2026-02-24 | 13F | DGS Capital Management, LLC | 81.021 | 3,43 | 1.444 | 13,27 | ||||
| 2026-02-13 | 13F | Pinpoint Asset Management (Singapore) Pte. Ltd. | 0 | -100,00 | 0 | |||||
| 2026-04-20 | 13F | Ritholtz Wealth Management | 16.709 | -68,80 | 226 | -76,42 | ||||
| 2026-02-04 | 13F | C WorldWide Group Holding A/S | 513.217 | -13,79 | 9 | 0,00 | ||||
| 2025-11-14 | 13F | Moore Capital Management, Lp | 0 | -100,00 | 0 | |||||
| 2026-02-17 | 13F | Trexquant Investment LP | 62.718 | -90,61 | 1.118 | -89,72 | ||||
| 2026-01-29 | 13F | Resonant Capital Advisors, LLC | 0 | -100,00 | 0 | |||||
| 2026-02-17 | 13F | LMR Partners LLP | 147.240 | -74,92 | 2.624 | -72,54 | ||||
| 2026-01-23 | 13F | Steigerwald, Gordon & Koch Inc. | 408 | 0,00 | 7 | 16,67 | ||||
| 2026-02-13 | 13F | Johnson Investment Counsel Inc | 0 | -100,00 | 0 | |||||
| 2025-11-04 | 13F | Pineridge Advisors LLC | 300 | 0,00 | 5 | -20,00 | ||||
| 2026-02-11 | 13F | Buckingham Strategic Partners | 25.534 | -4,17 | 455 | 4,36 | ||||
| 2026-02-17 | 13F | Two Sigma Securities, Llc | 0 | -100,00 | 0 | |||||
| 2026-02-17 | 13F/A | Cantor Fitzgerald, L. P. | 0 | -100,00 | 0 | -100,00 | ||||
| 2026-04-16 | 13F | SG Americas Securities, LLC | 88.649 | -58,41 | 1 | -66,67 | ||||
| 2026-04-23 | 13F | Harbor Investment Advisory, Llc | 12.107 | -31,74 | 164 | -48,42 | ||||
| 2026-01-16 | 13F | Empirical Financial Services, LLC d.b.a. Empirical Wealth Management | 28.948 | 516 | ||||||
| 2026-04-20 | 13F | Assenagon Asset Management S.A. | 42.000 | 567 | ||||||
| 2026-02-04 | 13F | Boyd Watterson Asset Management Llc/oh | 754 | 0,00 | 13 | 8,33 | ||||
| 2026-02-17 | 13F | Man Group plc | 4.750.104 | -32,29 | 84.647 | -25,83 | ||||
| 2026-02-11 | 13F | Fox Run Management, L.l.c. | 19.318 | 344 | ||||||
| 2026-02-06 | 13F | Americana Partners, LLC | 20.460 | -5,22 | 365 | 3,70 | ||||
| 2026-02-17 | 13F | Kingdon Capital Management, L.l.c. | Put | 71.500 | 1.274 | |||||
| 2026-04-16 | 13F | CogentBlue Wealth Advisors, LLC | 0 | -100,00 | 0 | |||||
| 2026-04-13 | 13F | Trust Co | 66 | 0,00 | 1 | -100,00 | ||||
| 2026-02-17 | 13F | Sandler Capital Management | Call | 180.000 | 3.208 | |||||
| 2026-02-13 | 13F | Van Eck Associates Corp | 415.305 | -5,41 | 7 | 0,00 | ||||
| 2026-02-13 | 13F | Aigen Investment Management, Lp | 0 | -100,00 | 0 | |||||
| 2026-04-24 | 13F | Able Wealth Management LLC | 12.036 | 163 | ||||||
| 2026-02-13 | 13F | Neuberger Berman Group LLC | 78.422 | -68,35 | 1.397 | -65,34 | ||||
| 2026-02-11 | 13F | Group One Trading, L.p. | Call | 792.200 | 156,54 | 14.117 | 180,99 | |||
| 2026-02-11 | 13F | Group One Trading, L.p. | Put | 203.700 | 1.119,76 | 3.630 | 1.239,11 | |||
| 2026-02-12 | 13F | Earnest Partners Llc | 139.743 | 2,73 | 2.490 | 12,52 | ||||
| 2026-02-13 | 13F | Toroso Investments, LLC | 44.250 | 22,80 | 789 | 34,47 | ||||
| 2026-04-08 | 13F | Seed Wealth Management, Inc. | 13.950 | 0,00 | 188 | -24,19 | ||||
| 2026-02-11 | 13F | West Family Investments, Inc. | 61.929 | -26,70 | 1.104 | -19,72 | ||||
| 2026-02-17 | 13F | Laidlaw Wealth Management LLC | 11.200 | 0,00 | 200 | 9,34 | ||||
| 2026-02-10 | 13F | Daiwa Securities Group Inc. | 4.796.200 | 26,51 | 85 | -2,30 | ||||
| 2026-02-03 | 13F | Maxi Investments CY Ltd | 31.000 | 1 | ||||||
| 2026-02-11 | 13F | Situational Awareness LP | Put | 500.000 | 8.910 | |||||
| 2026-02-13 | 13F | Bridgefront Capital, LLC | 0 | -100,00 | 0 | |||||
| 2026-03-04 | 13F | Rehmann Capital Advisory Group | 0 | -100,00 | 0 | |||||
| 2026-02-03 | 13F | Mitsubishi UFJ Kokusai Asset Management Co., Ltd. | 0 | -100,00 | 0 | -100,00 | ||||
| 2026-02-09 | 13F | Geode Capital Management, Llc | 414.618 | 0,89 | 7.388 | 10,50 | ||||
| 2026-01-28 | 13F | B. Metzler seel. Sohn & Co. AG | 482.863 | 109,24 | 8.620 | 129,60 | ||||
| 2026-02-13 | 13F | Maplelane Capital, Llc | Call | 600.000 | 10.971 | |||||
| 2026-02-10 | 13F | Peapack Gladstone Financial Corp | 40.172 | 2,94 | 1 | |||||
| 2026-04-22 | 13F | Janney Montgomery Scott LLC | 718.477 | 0,95 | 10 | -25,00 | ||||
| 2026-02-13 | 13F | Cornerstone Financial Management LLC | 681 | 12 | ||||||
| 2026-02-10 | 13F | Goldman Sachs Group Inc | Put | 2.376.600 | -25,12 | 42.351 | -17,99 | |||
| 2026-02-12 | 13F | Quadrant Capital Group Llc | 363.122 | 26,87 | 6.471 | 38,96 | ||||
| 2026-02-12 | 13F | Alps Advisors Inc | 74.571 | -8,82 | 1.329 | -0,15 | ||||
| 2026-04-21 | 13F | Robeco Institutional Asset Management B.V. | 38.569.713 | 12,21 | 521.077 | -14,93 | ||||
| 2026-01-15 | 13F | J. Safra Sarasin Holding AG | 10.470 | 0,00 | 183 | 5,20 | ||||
| 2025-11-14 | 13F | Axa S.a. | 0 | -100,00 | 0 | |||||
| 2026-02-17 | 13F | Capstone Investment Advisors, Llc | 0 | -100,00 | 0 | -100,00 | ||||
| 2026-04-14 | 13F | Clean Yield Group | 254 | 0,00 | 3 | -25,00 | ||||
| 2026-04-07 | 13F | Farther Finance Advisors, LLC | 19.992 | 28,19 | 266 | -4,33 | ||||
| 2026-02-17 | 13F | Tower Research Capital LLC (TRC) | 11.677 | 111,27 | 208 | 133,71 | ||||
| 2026-04-15 | 13F | Park Capital Management, LLC / WI | 13.684 | 185 | ||||||
| 2026-02-13 | 13F | Capula Management Ltd | Call | 0 | -100,00 | 0 | -100,00 | |||
| 2026-02-18 | 13F | Mackenzie Financial Corp | 833.110 | -7,88 | 15.000 | 1,94 | ||||
| 2026-02-19 | 13F | Invesco Ltd. | 3.779.134 | -35,51 | 67.344 | -29,37 | ||||
| 2026-02-17 | 13F | Guggenheim Capital Llc | 96.048 | -0,96 | 1.712 | 8,50 | ||||
| 2026-02-17 | 13F | Crawford Investment Counsel Inc | 0 | -100,00 | 0 | |||||
| 2026-02-06 | 13F | Handelsbanken Fonder AB | 73.794 | 22,99 | 1 | |||||
| 2026-02-14 | 13F | Frec Markets, Inc. | 13.316 | 237 | ||||||
| 2026-02-17 | 13F | Advisor Group Holdings, Inc. | 121.397 | -5,16 | 2.163 | 1,26 | ||||
| 2026-03-06 | 13F | Hsbc Holdings Plc | 4.983.045 | -45,34 | 91.851 | -39,09 | ||||
| 2026-04-24 | 13F | Yousif Capital Management, Llc | 29.803 | -8,62 | 403 | -32,21 | ||||
| 2026-02-11 | 13F | LPL Financial LLC | 249.703 | -7,65 | 4.450 | 1,14 | ||||
| 2026-01-08 | 13F | Tuttle Tactical Management LLC | 14.959 | 267 | ||||||
| 2026-02-05 | 13F | LGT Fund Management Co Ltd. | 0 | -100,00 | 0 | |||||
| 2026-02-09 | 13F | Employees Retirement System of Texas | 214.120 | 21,55 | 4 | 50,00 | ||||
| 2026-02-17 | 13F | Shelton Capital Management | 62.562 | 122,43 | 1.115 | 143,76 | ||||
| 2026-02-17 | 13F | Old Mission Capital Llc | 135.393 | 2.413 | ||||||
| 2026-04-06 | 13F | Rosenberg Matthew Hamilton | 6.687 | -10,92 | 90 | -32,33 | ||||
| 2026-04-03 | 13F | Adirondack Trust Co | 300 | 0,00 | 4 | -20,00 | ||||
| 2025-11-14 | 13F | Chevy Chase Trust Holdings, Inc. | 0 | -100,00 | 0 | |||||
| 2025-10-31 | 13F | Whittier Trust Co | 0 | -100,00 | 0 | -100,00 | ||||
| 2026-04-14 | 13F | BSW Wealth Partners | 27.379 | -23,16 | 370 | -41,80 | ||||
| 2026-02-17 | 13F | Snowden Capital Advisors LLC | 22.923 | 12,90 | 408 | 23,64 | ||||
| 2026-02-10 | 13F | Norges Bank | 449.627 | 8.012 | ||||||
| 2025-11-13 | 13F | Infini Capital Management Ltd | 0 | -100,00 | 0 | -100,00 | ||||
| 2026-02-13 | 13F | Royal London Asset Management Ltd | 0 | -100,00 | 0 | |||||
| 2026-02-17 | 13F | Raymond James Financial Inc | 65.934 | 2,29 | 1.175 | 12,02 | ||||
| 2026-02-11 | 13F | Saturna Capital CORP | 210.000 | 3.742 | ||||||
| 2026-02-17 | 13F | Amundi | 1.055.091 | -8,15 | 18.802 | -1,94 | ||||
| 2026-02-23 | 13F | Virtu Financial LLC | 118.971 | 267,22 | 2 | |||||
| 2025-11-06 | 13F | Whipplewood Advisors, LLC | 0 | -100,00 | 0 | |||||
| 2026-03-26 | 13F/A | Peak6 Llc | Put | 0 | -100,00 | 0 | -100,00 | |||
| 2026-02-10 | 13F | Goldman Sachs Group Inc | 7.004.022 | -38,16 | 124.812 | -32,27 | ||||
| 2025-11-13 | 13F | Blueshift Asset Management, LLC | 0 | -100,00 | 0 | -100,00 | ||||
| 2026-02-12 | 13F | Brinker Capital Investments, LLC | 35.649 | 4,98 | 635 | 15,04 | ||||
| 2026-02-17 | 13F | Fmr Llc | 3.226.786 | 1.936,80 | 57.501 | 2.131,32 | ||||
| 2026-02-13 | 13F | FORA Capital, LLC | 0 | -100,00 | 0 | |||||
| 2026-04-23 | 13F | North Star Investment Management Corp. | 353 | -42,13 | 5 | -60,00 | ||||
| 2026-01-15 | 13F | Range Financial Group LLC | 32.768 | 3,05 | 584 | 12,77 | ||||
| 2026-02-06 | 13F | Abn Amro Investment Solutions | 513.328 | 182,53 | 9.148 | 209,44 | ||||
| 2026-02-10 | 13F | Private Wealth Asset Management, LLC | 0 | -100,00 | 0 | |||||
| 2026-01-27 | 13F | Human Investing LLC | 18.119 | -4,05 | 323 | 4,89 | ||||
| 2025-11-06 | 13F | Westover Capital Advisors, LLC | 0 | -100,00 | 0 | |||||
| 2026-04-10 | 13F | Armstrong Advisory Group, Inc | 58 | 0,00 | 1 | -100,00 | ||||
| 2026-01-15 | 13F | LeConte Wealth Management, LLC | 22.066 | 9,75 | 393 | 20,18 | ||||
| 2026-02-17 | 13F | SummitTX Capital, L.P. | 24.200 | 431 | ||||||
| 2026-04-14 | 13F | Thurston, Springer, Miller, Herd & Titak, Inc. | 1.200 | 0,00 | 16 | -23,81 | ||||
| 2026-02-03 | 13F | McIlrath & Eck, LLC | 0 | -100,00 | 0 | |||||
| 2026-02-03 | 13F | Ethic Inc. | 252.179 | 17,69 | 4.494 | 28,89 | ||||
| 2026-02-13 | 13F | Gts Securities Llc | 134.781 | 71,09 | 2.402 | 87,43 | ||||
| 2026-02-13 | 13F | American Century Companies Inc | 5.120.002 | 9,20 | 91.238 | 19,60 | ||||
| 2026-02-13 | 13F | Marshall Wace, Llp | 0 | -100,00 | 0 | |||||
| 2026-02-17 | 13F | SageView Advisory Group, LLC | 296 | 5 | ||||||
| 2026-02-17 | 13F | Farringdon Capital, Ltd. | 0 | -100,00 | 0 | |||||
| 2025-11-12 | 13F | Group One Trading, L.p. | 0 | -100,00 | 0 | -100,00 | ||||
| 2025-11-20 | 13F | Ariadne Wealth Management, LP | 0 | -100,00 | 0 | |||||
| 2026-04-14 | 13F | Banque Pictet & Cie Sa | 164.105 | -0,43 | 2.217 | -24,51 | ||||
| 2026-02-12 | 13F | Johnson Financial Group, Inc. | 1.320 | 0,00 | 24 | 9,52 | ||||
| 2026-02-03 | 13F | Crossmark Global Holdings, Inc. | 1.018.790 | 1,59 | 18.155 | 11,27 | ||||
| 2026-02-13 | 13F | Atika Capital Management LLC | Put | 0 | -100,00 | 0 | ||||
| 2026-02-12 | 13F | Principal Securities, Inc. | 0 | -100,00 | 0 | -100,00 | ||||
| 2026-02-17 | 13F | Glenmede Trust Co Na | 17.876 | 1,29 | 319 | -1,24 | ||||
| 2026-02-12 | 13F | Canopy Partners, LLC | 18.718 | 2,27 | 334 | 12,12 | ||||
| 2026-04-22 | 13F | ABN AMRO Bank N.V. | 36.000 | 0,00 | 489 | -23,63 | ||||
| 2026-02-11 | 13F | Empowered Funds, LLC | 158.513 | 2.825 | ||||||
| 2026-02-13 | 13F | Walleye Trading LLC | Put | 76.800 | 910,53 | 1.369 | 1.012,20 | |||
| 2026-02-13 | 13F | Walleye Trading LLC | Call | 156.500 | 153,65 | 2.789 | 177,97 | |||
| 2026-01-29 | 13F | Rakuten Securities, Inc. | 778 | 40,43 | 14 | 44,44 | ||||
| 2026-02-09 | 13F | Hantz Financial Services, Inc. | 104.926 | 130,81 | 2 | |||||
| 2026-02-17 | 13F | Lazard Asset Management Llc | 22.882.693 | 18,93 | 407.770 | 30,26 | ||||
| 2026-02-17 | 13F | Engineers Gate Manager LP | 16.379 | -81,32 | 292 | -79,59 | ||||
| 2026-02-17 | 13F | Altrinsic Global Advisors Llc | 18.160 | -3,81 | 324 | 5,21 | ||||
| 2026-02-10 | 13F | Triglav Skladi, D.o.o. | 84.825 | 59,66 | 1.512 | 74,88 | ||||
| 2026-04-10 | 13F | Novem Group | 67.624 | 5,53 | 914 | -19,98 | ||||
| 2026-02-11 | 13F | Syon Capital Llc | 12.628 | 225 | ||||||
| 2026-02-12 | 13F | Wealthspire Advisors, LLC | 0 | -100,00 | 0 | |||||
| 2026-04-20 | 13F | Jfs Wealth Advisors, Llc | 0 | -100,00 | 0 | |||||
| 2026-02-05 | 13F | Elyxium Wealth, LLC | 2.202 | 39 | ||||||
| 2026-02-13 | 13F | Colony Group, LLC | 56.937 | 43,29 | 1.005 | 55,57 | ||||
| 2025-11-10 | 13F | Nkcfo Llc | 0 | -100,00 | 0 | |||||
| 2026-02-10 | 13F | Bank of New York Mellon Corp | 671.532 | -23,72 | 11.967 | -16,46 | ||||
| 2026-02-13 | 13F | National Bank Of Canada /fi/ | 13.409 | 8,02 | 239 | 18,41 | ||||
| 2026-01-27 | 13F | Hgk Asset Management Inc | 2.845.690 | 1,32 | 50.710 | 10,98 | ||||
| 2026-02-12 | 13F | Hollencrest Capital Management | 304 | 0,00 | 5 | 25,00 | ||||
| 2025-10-27 | 13F | RWC Asset Management LLP | 0 | -100,00 | 0 | |||||
| 2026-01-29 | 13F | Sava Infond d.o.o. | 40.000 | 0,00 | 713 | 9,54 | ||||
| 2026-02-12 | 13F | StoneX Group Inc. | 13.204 | -11,74 | 235 | -3,29 | ||||
| 2026-02-12 | 13F | Commonwealth Equity Services, Llc | 43.488 | 0,63 | 775 | |||||
| 2026-02-13 | 13F | JustInvest LLC | 233.556 | 30,44 | 4.162 | 42,84 | ||||
| 2025-10-30 | 13F | Twin Peaks Wealth Advisors, LLC | 0 | -100,00 | 0 | |||||
| 2026-02-17 | 13F | Caption Management, LLC | Put | 160.000 | 128,57 | 2.851 | 150,53 | |||
| 2026-04-21 | 13F | GHP Investment Advisors, Inc. | 12.600 | 0,00 | 170 | -24,11 | ||||
| 2026-01-23 | 13F | Westside Investment Management, Inc. | 2.108 | 0,00 | 38 | 11,76 | ||||
| 2026-02-06 | 13F | Covestor Ltd | Put | 4 | 0,00 | 0 | ||||
| 2026-02-13 | 13F | Squarepoint Ops LLC | Call | 0 | -100,00 | 0 | -100,00 | |||
| 2026-02-10 | 13F | Acadian Asset Management Llc | 25.766.315 | -20,38 | 459 | -12,74 | ||||
| 2026-02-06 | 13F | EverSource Wealth Advisors, LLC | 5.892 | 11,21 | 105 | 20,93 | ||||
| 2026-02-13 | 13F | Corient IA LLC | 0 | -100,00 | 0 | |||||
| 2025-11-12 | 13F | Northwest & Ethical Investments L.P. | 0 | -100,00 | 0 | -100,00 | ||||
| 2025-11-12 | 13F | Victory Capital Management Inc | 0 | -100,00 | 0 | |||||
| 2026-02-13 | 13F | Integrated Wealth Concepts LLC | 0 | -100,00 | 0 | |||||
| 2026-02-17 | 13F | Avantyr Capital Partners, LP | 662.446 | 11.805 | ||||||
| 2026-02-17 | 13F | Capital Fund Management S.a. | Put | 84.000 | 97,65 | 1.497 | 116,50 | |||
| 2026-02-12 | 13F | Integrated Quantitative Investments LLC | 94.890 | -33,44 | 1.691 | -27,12 | ||||
| 2026-02-17 | 13F | Capital Fund Management S.a. | Call | 135.300 | 60,88 | 2.411 | 76,24 | |||
| 2026-04-22 | 13F | Clear Creek Financial Management, LLC | 33.764 | 5,73 | 456 | -19,86 | ||||
| 2026-04-24 | 13F | UMA Financial Services, Inc. | 547 | -38,40 | 7 | -53,33 | ||||
| 2026-04-22 | 13F | Harbor Asset Planning, Inc. | 511 | 0,00 | 7 | -33,33 | ||||
| 2026-02-13 | 13F | Pinnacle Wealth Planning Services, Inc. | 14.082 | 9,66 | 251 | 20,19 | ||||
| 2026-02-18 | 13F | Wahed Invest LLC | 67.805 | 6,89 | 1.208 | 17,05 | ||||
| 2026-04-24 | 13F | Abacus Wealth Partners, LLC | 45.297 | -35,45 | 612 | -51,12 | ||||
| 2026-02-13 | 13F | Hudson Portfolio Management LLC | 137.035 | 1,91 | 2.442 | 11,61 | ||||
| 2026-04-17 | 13F | Outlook Wealth Advisors, LLC | 18.477 | 0,09 | 250 | -24,09 | ||||
| 2026-04-14 | 13F | Pictet & Cie (Europe) SA | 108.027 | -1,10 | 1.459 | -25,03 | ||||
| 2026-02-17 | 13F | Quadrature Capital Ltd | 162.570 | 2.897 | ||||||
| 2026-02-10 | 13F | Bnp Paribas Arbitrage, Sa | 3.447.437 | -6,43 | 61.433 | 2,49 | ||||
| 2026-04-01 | 13F | Confluence Investment Management Llc | 14.810 | 4,75 | 200 | -20,32 | ||||
| 2026-02-10 | 13F | Bnp Paribas Arbitrage, Sa | Put | 1.630 | 2.905 | |||||
| 2026-02-11 | 13F | Parallel Advisors, LLC | 55.031 | 1,67 | 981 | 11,36 | ||||
| 2026-02-12 | 13F | JPL Wealth Management, LLC | 0 | -100,00 | 0 | |||||
| 2026-02-12 | 13F | Xponance, Inc. | 15.887 | 15,54 | 283 | 26,91 | ||||
| 2026-02-13 | 13F | Squarepoint Ops LLC | 182.693 | -53,73 | 3.256 | -49,33 | ||||
| 2026-04-02 | 13F | Somerset Trust Co | 16.525 | 0,06 | 223 | -24,15 | ||||
| 2026-04-06 | 13F | Highline Wealth Partners Llc | 0 | -100,00 | 0 | |||||
| 2026-04-13 | 13F | Foster Group, Inc. | 0 | -100,00 | 0 | |||||
| 2026-04-23 | 13F | Oppenheimer Asset Management Inc. | 23.075 | -95,26 | 312 | -96,42 | ||||
| 2026-02-13 | 13F | Verition Fund Management LLC | 0 | -100,00 | 0 | |||||
| 2026-02-12 | 13F | Logan Capital Management Inc | 98.192 | 0,00 | 1.750 | 9,52 | ||||
| 2026-01-26 | 13F | Private Trust Co Na | 0 | -100,00 | 0 | |||||
| 2025-11-10 | 13F | AMJ Financial Wealth Management | 0 | -100,00 | 0 | -100,00 | ||||
| 2026-01-12 | 13F | CVA Family Office, LLC | 13.000 | 0,00 | 232 | 9,48 | ||||
| 2026-04-06 | 13F | GAMMA Investing LLC | 9.139 | 26,95 | 123 | -3,91 | ||||
| 2026-01-29 | 13F | Munich Reinsurance Co Stock Corp in Munich | 525.854 | 408,56 | 9.486 | 463,97 | ||||
| 2026-02-12 | 13F | Empower Advisory Group, LLC | 14.080 | 0,00 | 251 | 9,17 | ||||
| 2025-11-12 | 13F | HAP Trading, LLC | Put | 140.700 | 113 | |||||
| 2026-01-29 | 13F | UBS Group AG | Put | 292.500 | 5.212 | |||||
| 2026-01-29 | 13F | UBS Group AG | Call | 193.167 | -45,17 | 3.442 | -39,95 | |||
| 2025-11-12 | 13F | HAP Trading, LLC | 18.878 | 307 | ||||||
| 2026-01-29 | 13F | UBS Group AG | 17.782.859 | -12,80 | 316.891 | -4,50 | ||||
| 2026-02-13 | 13F | Strategic Global Advisors, LLC | 16.430 | 18,97 | 293 | 30,36 | ||||
| 2026-02-05 | 13F | Rayburn West Financial Services LLC | 22.658 | 404 | ||||||
| 2026-02-13 | 13F | Centiva Capital, LP | 0 | -100,00 | 0 | |||||
| 2026-02-17 | 13F | Aspen Grove Capital, LLC | 18.314 | -21,50 | 326 | -13,98 | ||||
| 2026-01-15 | 13F | Nisa Investment Advisors, Llc | 2.454 | 44 | ||||||
| 2026-02-17 | 13F | Credit Agricole S A | 341.174 | 0,21 | 6.080 | 9,75 | ||||
| 2026-01-26 | 13F | Cwm, Llc | 315.463 | -0,20 | 6 | 0,00 | ||||
| 2026-02-10 | 13F | Quantbot Technologies LP | 0 | -100,00 | 0 | |||||
| 2026-02-06 | 13F | Kilter Group LLC | 0 | -100,00 | 0 | |||||
| 2026-02-17 | 13F | Private Advisor Group, LLC | 0 | -100,00 | 0 | |||||
| 2026-02-03 | 13F | BHK Investment Advisors, LLC | 0 | -100,00 | 0 | |||||
| 2026-02-17 | 13F | Northern Trust Corp | 3.505.201 | -2,69 | 62.463 | 6,58 | ||||
| 2026-02-17 | 13F | Coatue Management Llc | 4.574.706 | 81.521 | ||||||
| 2026-01-23 | 13F | Assetmark, Inc | 31.404 | -33,96 | 560 | -27,68 | ||||
| 2026-01-30 | 13F | Us Bancorp \de\ | 142.687 | -50,27 | 2.543 | -45,54 | ||||
| 2026-01-29 | 13F | Vanguard Group Inc | 3.745.869 | -4,71 | 66.751 | 4,37 | ||||
| 2026-02-02 | 13F | Fifth Third Bancorp | 2.000 | 0,00 | 36 | 9,38 | ||||
| 2026-01-15 | 13F | Allspring Global Investments Holdings, LLC | 1.459.899 | 4,04 | 26.497 | 15,35 | ||||
| 2026-02-12 | 13F | DRW Securities, LLC | 22.826 | -79,19 | 407 | -76,80 | ||||
| 2026-02-13 | 13F | Sei Investments Co | 2.982.225 | -5,42 | 53.143 | 3,59 | ||||
| 2025-11-07 | 13F | Beacon Capital Management, LLC | 0 | -100,00 | 0 | |||||
| 2026-02-10 | 13F | Redwood Financial Network Corp | 0 | -100,00 | 0 | |||||
| 2026-02-17 | 13F | Tudor Investment Corp Et Al | Put | 206.600 | 3.682 | |||||
| 2026-04-16 | 13F | Davis Capital Management | 29.488 | -8,93 | 398 | -30,90 | ||||
| 2026-02-11 | 13F | Allianz Asset Management GmbH | 52.102 | -89,86 | 928 | -88,90 | ||||
| 2026-04-21 | 13F | Laurel Oak Wealth Management, Llc | 0 | -100,00 | 0 | |||||
| 2026-02-17 | 13F | Tudor Investment Corp Et Al | Call | 83.900 | 1.495 | |||||
| 2026-02-13 | 13F | National Bank Of Canada /fi/ | Put | 5 | 9 | |||||
| 2026-04-21 | 13F | Aaron Wealth Advisors LLC | 49.399 | 156,80 | 667 | 95,03 | ||||
| 2026-01-26 | 13F | Mirae Asset Global Investments Co., Ltd. | 124.990 | -16,16 | 2.227 | -8,16 | ||||
| 2026-02-17 | 13F | Jump Financial, LLC | 39.262 | 153,37 | 700 | 177,38 | ||||
| 2026-02-10 | 13F | Belvedere Trading LLC | Call | 14.700 | 262 | |||||
| 2026-02-10 | 13F | Eurizon SLJ Capital Ltd | 433.600 | 7.727 | ||||||
| 2026-02-17 | 13F | Creative Planning | 1.281.591 | 49,23 | 22.838 | 63,45 | ||||
| 2026-02-17 | 13F | Point72 Asset Management, L.P. | Put | 855.000 | 15.236 | |||||
| 2026-01-21 | 13F | Prime Capital Investment Advisors, LLC | 0 | -100,00 | 0 | |||||
| 2026-02-12 | 13F | BlackRock, Inc. | 13.511.162 | -22,74 | 240.769 | -15,38 | ||||
| 2026-02-09 | 13F | Morningstar Investment Management LLC | 0 | -100,00 | 0 | |||||
| 2026-02-17 | 13F | Sandler Capital Management | Put | 0 | -100,00 | 0 | ||||
| 2026-04-24 | 13F | Root Financial Partners, LLC | 206 | 3 | ||||||
| 2025-10-31 | 13F | Sagespring Wealth Partners, Llc | 0 | -100,00 | 0 | |||||
| 2026-04-23 | 13F | CWM Advisors, LLC | 19 | 11,76 | 0 | |||||
| 2026-02-17 | 13F | Susquehanna International Group, Llp | 118.293 | 189,78 | 2.108 | 217,32 | ||||
| 2026-02-17 | 13F | Susquehanna International Group, Llp | Put | 1.052.900 | -22,14 | 18.763 | -14,72 | |||
| 2026-02-13 | 13F | Baldwin Investment Management, LLC | 74.840 | 0,00 | 1.334 | 9,53 | ||||
| 2026-02-10 | 13F | Envestnet Asset Management Inc | 592.887 | -15,87 | 10.565 | -7,86 | ||||
| 2026-02-11 | 13F | Ovata Capital Management Ltd | 218.082 | 50,33 | 4.012 | 69,89 | ||||
| 2026-02-17 | 13F | Susquehanna International Group, Llp | Call | 1.007.700 | 240,55 | 17.957 | 273,02 | |||
| 2026-04-17 | 13F | Bell Investment Advisors, Inc | 1.708 | -12,63 | 23 | -32,35 | ||||
| 2026-02-12 | 13F | Rossby Financial, LCC | 58 | 0,00 | 1 | |||||
| 2026-01-30 | 13F | State of New Jersey Common Pension Fund D | 2.883.342 | -6,27 | 51.381 | 2,66 | ||||
| 2026-02-06 | 13F | Vestmark Advisory Solutions, Inc. | 20.590 | 49,67 | 367 | 64,13 | ||||
| 2026-02-13 | 13F | Segall Bryant & Hamill, Llc | 65.600 | 0,00 | 1.169 | 9,47 | ||||
| 2025-11-12 | 13F | NewSquare Capital LLC | 0 | -100,00 | 0 | |||||
| 2026-02-12 | 13F | Advisory Resource Group | 57.998 | -22,54 | 1.034 | -15,19 | ||||
| 2026-04-14 | 13F | Beacon Investment Advisory Services, Inc. | 1.200 | 16 | ||||||
| 2026-04-20 | 13F | Arta Finance Wealth Management LLC | 41.758 | 17,86 | 564 | -10,62 | ||||
| 2026-02-17 | 13F | Voleon Capital Management Lp | 0 | -100,00 | 0 | |||||
| 2026-02-17 | 13F | Aqr Capital Management Llc | 8.004.545 | -22,91 | 142.641 | -15,56 | ||||
| 2026-02-17 | 13F | Capital Fund Management S.a. | 0 | -100,00 | 0 | |||||
| 2026-01-30 | 13F | Exencial Wealth Advisors, Llc | 30.483 | 1,42 | 543 | 11,27 | ||||
| 2026-04-13 | 13F | Mather Group, Llc. | 362 | 5 | ||||||
| 2026-01-28 | 13F | Migdal Insurance & Financial Holdings Ltd. | 90.179 | 0,00 | 2 | 0,00 | ||||
| 2026-02-04 | 13F | Nwam Llc | 10.470 | -0,10 | 189 | 9,88 | ||||
| 2026-02-13 | 13F | Arrowstreet Capital, Limited Partnership | 5.969.189 | 180,38 | 106.371 | 207,10 | ||||
| 2026-01-26 | 13F | La Banque Postale Asset Management SA | 105.100 | 0,00 | 1.873 | 9,54 | ||||
| 2026-02-04 | 13F | Atlantic Union Bankshares Corp | 50 | -33,33 | 1 | -100,00 | ||||
| 2026-02-11 | 13F | Longfellow Investment Management Co Llc | 122.834 | -13,28 | 2.189 | -5,03 | ||||
| 2026-02-17 | 13F | Voloridge Investment Management, Llc | 0 | -100,00 | 0 | |||||
| 2026-01-15 | 13F | Frank, Rimerman Advisors LLC | 133.624 | 63,57 | 2.381 | 79,16 | ||||
| 2026-02-06 | 13F | Global Retirement Partners, LLC | 7.298 | -27,63 | 130 | -20,73 | ||||
| 2026-02-12 | 13F | DRW Securities, LLC | Put | 0 | -100,00 | 0 | -100,00 | |||
| 2026-02-10 | 13F | Savant Capital, LLC | 14.441 | 29,16 | 257 | 41,99 | ||||
| 2026-02-17 | 13F | Jones Financial Companies Lllp | 8.475 | 36,58 | 151 | 48,04 | ||||
| 2026-01-23 | 13F | Ti-trust, Inc | 22.753 | 0,00 | 405 | 9,46 | ||||
| 2026-01-29 | 13F | Pictet Asset Management Holding SA | 0 | -100,00 | 0 | |||||
| 2026-01-30 | 13F | Mitsubishi UFJ Trust & Banking Corp | 59.067 | 6,27 | 1.053 | 16,37 | ||||
| 2026-01-16 | 13F | FNY Investment Advisers, LLC | 0 | -100,00 | 0 | |||||
| 2026-02-17 | 13F | Fwl Investment Management, Llc | 1.003 | 0,00 | 18 | 6,25 | ||||
| 2025-11-13 | 13F | Glenmede Investment Management, LP | 17.604 | -7,23 | 286 | -18,52 | ||||
| 2026-02-10 | 13F | Greenspring Advisors, LLC | 18.249 | 325 | ||||||
| 2026-02-17 | 13F | United Capital Financial Advisers, Llc | 17.103 | 33,91 | 305 | 46,86 | ||||
| 2026-02-13 | 13F | Citigroup Inc | 1.108.054 | 3,34 | 19.746 | 13,19 | ||||
| 2026-02-04 | 13F | Madison Asset Management, LLC | 117.830 | -4,05 | 2.100 | 5,06 | ||||
| 2026-02-13 | 13F | Citigroup Inc | Put | 48.800 | 870 | |||||
| 2026-02-06 | 13F | Fairtree Asset Management (Pty) Ltd | 26.967 | 0,00 | 481 | 9,59 | ||||
| 2026-02-18 | 13F | Vident Advisory, LLC | 158.286 | 0,86 | 2.821 | 10,46 | ||||
| 2026-02-13 | 13F | Schroder Investment Management Group | 3.627.189 | -16,84 | 65.434 | -8,07 | ||||
| 2026-04-10 | 13F | Abound Wealth Management | 60 | -39,39 | 1 | -100,00 | ||||
| 2026-01-21 | 13F | Trivant Custom Portfolio Group, LLC | 50.061 | -1,73 | 892 | 7,73 | ||||
| 2026-02-05 | 13F | Cambridge Investment Research Advisors, Inc. | 26.636 | 0 | ||||||
| 2026-03-12 | 13F/A | Peak6 Llc | 0 | -100,00 | 0 | -100,00 | ||||
| 2025-11-05 | 13F | Flagship Harbor Advisors, Llc | 0 | -100,00 | 0 | -100,00 | ||||
| 2026-02-13 | 13F | OMERS ADMINISTRATION Corp | 127.874 | -11,64 | 2.279 | -3,23 | ||||
| 2026-02-09 | 13F | Freemont Capital Pte Ltd | 0 | -100,00 | 0 | |||||
| 2026-02-12 | 13F | New York State Common Retirement Fund | 726.617 | -55,97 | 12.948 | -51,78 | ||||
| 2026-02-13 | 13F | Vontobel Holding Ltd. | 0 | -100,00 | 0 | |||||
| 2026-04-24 | 13F | Deprince Race & Zollo Inc | 0 | -100,00 | 0 | |||||
| 2026-02-13 | 13F | Virtus ETF Advisers LLC | 6.100 | 109 | ||||||
| 2025-11-12 | 13F | William Blair Investment Management, Llc | 0 | -100,00 | 0 | -100,00 | ||||
| 2026-04-10 | 13F | Perigon Wealth Management, LLC | 11.888 | -8,28 | 161 | -30,43 | ||||
| 2026-02-13 | 13F | Caitong International Asset Management Co., Ltd | 0 | -100,00 | 0 | |||||
| 2026-01-28 | 13F | CAPROCK Group, Inc. | 61.160 | -18,85 | 1.090 | -14,05 | ||||
| 2026-04-24 | 13F | Trinity Street Asset Management LLP | 14.938.546 | 45,55 | 201.820 | 10,34 | ||||
| 2026-02-13 | 13F | Barclays Plc | 2.382.004 | -12,98 | 42.447 | -4,69 | ||||
| 2026-02-13 | 13F | Thornburg Investment Management Inc | 16.738 | -32,14 | 298 | -25,69 | ||||
| 2026-02-13 | 13F | Barclays Plc | Call | 23.200 | -99,14 | 413 | -99,06 | |||
| 2026-02-12 | 13F | Advisors Asset Management, Inc. | 71.253 | 5,39 | 1.270 | 15,47 | ||||
| 2026-04-20 | 13F | Ronald Blue Trust, Inc. | 29.967 | -16,98 | 405 | -37,17 | ||||
| 2026-02-17 | 13F | D. E. Shaw & Co., Inc. | 2.709.125 | 48.277 | ||||||
| 2026-04-24 | 13F | Sumitomo Mitsui DS Asset Management Company, Ltd | 21.000 | 0,00 | 284 | -24,33 | ||||
| 2026-02-02 | 13F | Qrg Capital Management, Inc. | 22.833 | -23,38 | 407 | -16,12 | ||||
| 2026-01-23 | 13F | Rsm Us Wealth Management Llc | 13.713 | 5,68 | 247 | 17,06 | ||||
| 2026-01-26 | 13F | PFG Investments, LLC | 17.932 | -11,90 | 320 | -3,63 | ||||
| 2026-02-17 | 13F | Bank Of America Corp /de/ | 6.320.823 | -52,60 | 112.637 | -48,08 | ||||
| 2026-02-17 | 13F | Price T Rowe Associates Inc /md/ | 1.259.618 | -21,48 | 22 | -15,38 | ||||
| 2026-02-13 | 13F | Bennbridge Ltd | 76.400 | 1.361 | ||||||
| 2026-02-17 | 13F | Hilltop Holdings Inc. | 10.033 | 179 | ||||||
| 2025-11-14 | 13F | Mount Yale Investment Advisors, LLC | 0 | -100,00 | 0 | -100,00 | ||||
| 2026-04-02 | 13F | Marex Group plc | 0 | -100,00 | 0 | -100,00 | ||||
| 2026-02-12 | 13F | Foster Dykema Cabot & Partners, Llc | 0 | -100,00 | 0 | |||||
| 2026-02-13 | 13F | Wealth Alliance | 31.121 | 1,73 | 555 | 11,47 | ||||
| 2026-04-15 | 13F | Bayforest Capital Ltd | 18.095 | -31,34 | 244 | -47,97 | ||||
| 2026-02-05 | 13F | SkyOak Wealth, LLC | 14.564 | 260 | ||||||
| 2026-04-24 | 13F | Raiffeisen Bank International AG | 151.849 | 0,00 | 2.012 | -26,54 | ||||
| 2026-02-06 | 13F | HighTower Advisors, LLC | 50.919 | -67,23 | 907 | -64,11 | ||||
| 2026-01-22 | 13F | Massachusetts Financial Services Co /ma/ | 3.036.308 | 5,45 | 54.107 | 15,50 | ||||
| 2026-02-10 | 13F | Texas Yale Capital Corp. | 26.500 | 472 | ||||||
| 2026-02-17 | 13F | Modern Wealth Management, LLC | 16.379 | 5,57 | 292 | 15,48 | ||||
| 2026-01-21 | 13F | Greenleaf Trust | 20.971 | 16,03 | 374 | 26,87 | ||||
| 2026-02-13 | 13F | Arkadios Wealth Advisors | 18.229 | 45,91 | 325 | 59,61 | ||||
| 2026-04-22 | 13F | Spire Wealth Management | 245 | 0,00 | 3 | -25,00 | ||||
| 2026-02-17 | 13F | Oaktree Capital Management Lp | 1.094.752 | 19.508 | ||||||
| 2026-02-03 | 13F | NewEdge Wealth, LLC | 35.169 | 28,72 | 627 | 39,73 | ||||
| 2026-04-13 | 13F | Hm Payson & Co | 0 | -100,00 | 0 | |||||
| 2026-02-13 | 13F | 1832 Asset Management L.P. | 215.383 | 3.838 | ||||||
| 2026-02-17 | 13F | AIMZ Investment Advisors, LLC | 301.630 | -1,26 | 5.375 | 8,15 | ||||
| 2025-11-04 | 13F | Agf Management Ltd | 0 | -100,00 | 0 | |||||
| 2026-02-03 | 13F | Sequoia Financial Advisors, LLC | 164.991 | 9,33 | 2.940 | 19,76 | ||||
| 2026-01-22 | 13F | Bartlett & Co. Wealth Management Llc | 4.380 | 0,00 | 78 | 9,86 | ||||
| 2026-02-09 | 13F | Legal & General Group Plc | 929.554 | -0,57 | 16.569 | 8,96 | ||||
| 2026-02-13 | 13F | Evelyn Partners Investment Management LLP | 12.600 | 0,00 | 225 | 9,27 | ||||
| 2026-02-17 | 13F | Wellington Management Group Llp | 1.536.873 | -6,78 | 27.387 | 2,11 | ||||
| 2026-02-17 | 13F | Artisan Partners Limited Partnership | 60.191 | -20,16 | 1.073 | -12,56 | ||||
| 2026-02-05 | 13F | Td Private Client Wealth Llc | 0 | -100,00 | 0 | |||||
| 2026-01-20 | 13F | Ascent Group, LLC | 14.912 | 16,32 | 266 | 27,40 | ||||
| 2026-02-10 | 13F | Natixis Advisors, L.p. | 128.864 | -52,63 | 2 | -50,00 | ||||
| 2026-02-10 | 13F | Nomura Asset Management Co Ltd | 589.559 | -12,66 | 10.506 | -4,34 | ||||
| 2026-01-28 | 13F | Eagle Global Advisors Llc | 70.000 | 0,00 | 1.247 | 9,58 | ||||
| 2026-02-13 | 13F | Ubs Asset Management Americas Inc | 2.643 | -98,32 | 47 | -98,16 | ||||
| 2026-02-10 | 13F/A | Northwestern Mutual Wealth Management Co | 22.010 | -10,66 | 392 | -2,00 | ||||
| 2026-01-08 | 13F | Value Partners Investments Inc. | 0 | -100,00 | 0 | |||||
| 2026-02-10 | 13F | Td Asset Management Inc | 62.459 | 1,61 | 1.113 | 11,30 | ||||
| 2026-02-17 | 13F | Nomura Holdings Inc | 272.609 | -3,14 | 4.858 | 6,07 | ||||
| 2026-02-17 | 13F | Advisory Services Network, LLC | 0 | -100,00 | 0 | |||||
| 2026-02-17 | 13F | Nomura Holdings Inc | Put | 80.000 | 0,00 | 1.426 | 9,53 | |||
| 2026-02-10 | 13F | Bnp Paribas | 17.100 | 305 | ||||||
| 2026-02-13 | 13F | Pathstone Holdings, LLC | 104.852 | -15,50 | 1.868 | -7,43 | ||||
| 2026-04-21 | 13F | Maseco Llp | 440 | 0,00 | 6 | -28,57 | ||||
| 2026-02-10 | 13F | Sivia Capital Partners, LLC | 20.261 | -7,11 | 361 | 1,98 | ||||
| 2026-01-29 | 13F | Camelot Portfolios, LLC | 6.000 | 107 | ||||||
| 2025-11-03 | 13F | Knights of Columbus Asset Advisors LLC | 0 | -100,00 | 0 | -100,00 | ||||
| 2025-11-06 | 13F | OPTIMAS CAPITAL Ltd | 0 | -100,00 | 0 | -100,00 | ||||
| 2026-02-13 | 13F | SRS Capital Advisors, Inc. | 8.860 | 542,49 | 158 | 613,64 | ||||
| 2026-01-23 | 13F | Baillie Gifford & Co | 2.107.125 | -23,22 | 37.549 | -15,90 | ||||
| 2026-02-05 | 13F | May Hill Capital, LLC | 33.686 | 600 | ||||||
| 2026-02-17 | 13F | Warren Averett Asset Management, LLC | 315.208 | 1,38 | 5.617 | 11,05 | ||||
| 2026-04-16 | 13F | BI Asset Management Fondsmaeglerselskab A/S | 219.363 | 16,62 | 3 | -33,33 | ||||
| 2026-02-11 | 13F | Clearbridge Investments, LLC | 131.496 | -49,95 | 2.343 | -45,18 | ||||
| 2026-02-11 | 13F | Vestcor Inc | 53.448 | -67,36 | 1 | -100,00 | ||||
| 2026-02-10 | 13F | IAG Wealth Partners, LLC | 496 | 0,00 | 9 | 0,00 | ||||
| 2026-02-11 | 13F | Erste Asset Management GmbH | 100.000 | 1.843 | ||||||
| 2025-10-31 | 13F | Whittier Trust Co Of Nevada Inc | 0 | -100,00 | 0 | |||||
| 2025-11-10 | 13F | Barings Llc | 0 | -100,00 | 0 | |||||
| 2026-02-06 | 13F | Profund Advisors Llc | 123.841 | -0,06 | 2.207 | 9,42 | ||||
| 2025-11-04 | 13F | Gitterman Wealth Management, LLC | 0 | -100,00 | 0 | |||||
| 2025-12-09 | 13F/A | Tudor Investment Corp Et Al | 0 | -100,00 | 0 | -100,00 | ||||
| 2026-02-11 | 13F | OneAscent Investment Solutions LLC | 43.196 | 0,00 | 770 | 9,54 | ||||
| 2026-02-13 | 13F | Capula Management Ltd | 25.220 | -74,88 | 449 | -72,50 | ||||
| 2026-02-06 | 13F | Pnc Financial Services Group, Inc. | 99.529 | -11,23 | 1.774 | -2,80 | ||||
| 2026-02-13 | 13F | Tudor Financial Inc. | 22.270 | 0,00 | 397 | 9,39 | ||||
| 2026-01-28 | 13F | Geneos Wealth Management Inc. | 52.751 | -35,38 | 940 | -29,22 | ||||
| 2026-04-09 | 13F | Park Place Capital Corp | 948 | 0,00 | 13 | -25,00 | ||||
| 2026-02-17 | 13F | Schonfeld Strategic Advisors LLC | 93.154 | 137,52 | 1.660 | 160,19 | ||||
| 2026-01-23 | 13F | Lester Murray Antman dba SimplyRich | 46.453 | 2,27 | 1 | |||||
| 2025-12-18 | 13F | AIA Group Ltd | 0 | -100,00 | 0 | |||||
| 2026-04-21 | 13F | PDS Planning, Inc | 33.803 | -35,27 | 457 | -50,97 | ||||
| 2026-04-13 | 13F | True Wealth Design, LLC | 167 | -45,95 | 2 | -60,00 | ||||
| 2026-02-12 | 13F | Hrt Financial Lp | 379.200 | 7 | ||||||
| 2026-02-13 | 13F | Panagora Asset Management Inc | 2.269.781 | 26,60 | 40.447 | 38,66 | ||||
| 2026-02-17 | 13F | Russell Investments Group, Ltd. | 2.684.270 | -4,67 | 48.209 | 4,96 | ||||
| 2026-01-28 | 13F | DekaBank Deutsche Girozentrale | 1.119.802 | 0,00 | 21 | 11,11 | ||||
| 2026-02-04 | 13F | Mirabaud Asset Management Ltd | 160.550 | 55,50 | 3.527 | 109,44 | ||||
| 2026-02-09 | 13F | Genus Capital Management Inc. | 28.864 | 6,90 | 514 | 17,08 | ||||
| 2026-02-11 | 13F | Mirae Asset Securities (usa) Inc. | 119.098 | 2.122 | ||||||
| 2025-11-14 | 13F | Wolverine Trading, Llc | Call | 47.900 | 46,48 | 782 | 29,09 | |||
| 2025-11-14 | 13F | Wolverine Trading, Llc | Put | 32.500 | 200,93 | 530 | 165,00 | |||
| 2026-02-09 | 13F | Bleakley Financial Group, LLC | 0 | -100,00 | 0 | |||||
| 2026-02-17 | 13F | Public Employees Retirement System Of Ohio | 1.069.503 | -53,09 | 19.059 | -48,62 | ||||
| 2026-01-21 | 13F | Modera Wealth Management, LLC | 158.516 | -2,94 | 2.825 | 6,29 | ||||
| 2026-01-28 | 13F | Oversea-Chinese Banking CORP Ltd | 105.357 | -22,00 | 1.877 | -14,57 | ||||
| 2026-04-07 | 13F | Carolina Wealth Advisors, LLC | 175.595 | -47,23 | 2.372 | -59,99 | ||||
| 2026-04-24 | 13F | Deltec Asset Management Llc | 58.500 | 13,59 | 790 | -13,85 | ||||
| 2026-01-23 | 13F | Diversify Advisory Services, LLC | 0 | -100,00 | 0 | |||||
| 2026-02-05 | 13F | Thrivent Financial For Lutherans | 437.332 | -0,29 | 8 | 0,00 | ||||
| 2025-11-13 | 13F | Chesapeake Capital Corp /il/ | 0 | -100,00 | 0 | |||||
| 2026-02-13 | 13F | GQG Partners LLC | 29.130.383 | 35,19 | 519.103 | 48,07 | ||||
| 2026-02-04 | 13F | Community Bank, N.A. | 2.552 | 0,00 | 45 | 9,76 | ||||
| 2026-02-09 | 13F | Harbour Investments, Inc. | 56 | 0,00 | 1 | |||||
| 2026-02-13 | 13F | Baird Financial Group, Inc. | 297.099 | 125,48 | 5.294 | 147,04 | ||||
| 2025-11-14 | 13F | Fullerton Fund Management Co Ltd | 0 | -100,00 | 0 | -100,00 | ||||
| 2026-01-26 | 13F | Moran Wealth Management, LLC | 0 | -100,00 | 0 | |||||
| 2026-01-29 | 13F | Aprio Wealth Management, LLC | 12.728 | 227 | ||||||
| 2026-01-27 | 13F | Meritage Portfolio Management | 167.372 | 1,26 | 2.983 | 10,90 | ||||
| 2026-02-11 | 13F | Franklin Resources Inc | 7.938.226 | -25,50 | 141.459 | -18,41 | ||||
| 2026-04-08 | 13F | Wealth Enhancement Advisory Services, Llc | 23.402 | -75,57 | 322 | -81,48 | ||||
| 2026-02-11 | 13F | Jpmorgan Chase & Co | 29.337.008 | -16,74 | 522.785 | -8,81 | ||||
| 2026-02-17 | 13F | Ardsley Advisory Partners Lp | Put | 140.000 | 0,00 | 2.495 | 9,53 | |||
| 2026-01-16 | 13F | Standard Life Aberdeen plc | 163.675 | -47,23 | 2.917 | -42,36 | ||||
| 2026-02-13 | 13F | Prudential Financial Inc | 295.700 | -0,10 | 5.269 | 9,43 | ||||
| 2026-02-17 | 13F | New Vernon Capital Holdings II LLC | 336.718 | 0,00 | 6.000 | 9,53 | ||||
| 2025-11-05 | 13F | Moloney Securities Asset Management, LLC | 34.129 | -23,70 | 555 | -32,97 | ||||
| 2026-02-13 | 13F | Stifel Financial Corp | 143.025 | -7,41 | 2.549 | 1,39 | ||||
| 2026-02-13 | 13F | Sculptor Capital LP | Put | 332.900 | 23,80 | 5.932 | 35,59 | |||
| 2026-02-17 | 13F | Royal Bank Of Canada | 876.585 | 99,54 | 15.621 | 118,57 | ||||
| 2026-02-05 | 13F | LGT Group Foundation | 21.170 | 0,00 | 382 | 10,12 | ||||
| 2026-02-17 | 13F | Aquatic Capital Management LLC | 0 | -100,00 | 0 | |||||
| 2026-01-09 | 13F | Oldfield Partners LLP | 37.633 | -59,11 | 671 | -55,24 | ||||
| 2026-02-12 | 13F | Bank Of Montreal /can/ | 47.975 | -99,37 | 855 | -99,31 | ||||
| 2026-02-13 | 13F | Sculptor Capital LP | Call | 388.000 | 100,00 | 6.914 | 119,07 | |||
| 2026-02-13 | 13F | Sculptor Capital LP | 268.900 | -0,37 | 4.792 | 9,11 | ||||
| 2026-01-23 | 13F | Bridgewater Advisors Inc. | 33.350 | -7,37 | 611 | 4,81 | ||||
| 2026-02-13 | 13F | PCM Encore, LLC | 81.390 | 1.450 | ||||||
| 2026-04-24 | 13F | Key FInancial Inc | 979 | 0,00 | 13 | -23,53 | ||||
| 2026-02-17 | 13F | Jain Global LLC | 0 | -100,00 | 0 | |||||
| 2025-11-14 | 13F | AXA Investment Managers S.A. | 898.224 | 14.614 | ||||||
| 2026-01-13 | 13F | Kathmere Capital Management, LLC | 65.527 | 33,36 | 1.168 | 46,06 | ||||
| 2026-03-06 | 13F | Hsbc Holdings Plc | Call | 0 | -100,00 | 0 | ||||
| 2026-02-05 | 13F | Bessemer Group Inc | 1.152.135 | 20,09 | 21 | 33,33 | ||||
| 2026-02-13 | 13F | Mml Investors Services, Llc | 11.571 | -17,85 | 206 | -10,04 | ||||
| 2026-02-13 | 13F | Headlands Technologies LLC | 0 | -100,00 | 0 | |||||
| 2026-02-12 | 13F | Federation des caisses Desjardins du Quebec | 119.345 | -38,15 | 2.127 | -32,27 | ||||
| 2025-11-04 | 13F | High Note Wealth, LLC | 0 | -100,00 | 0 | |||||
| 2025-11-14 | 13F | Atom Investors LP | 0 | -100,00 | 0 | |||||
| 2026-02-11 | 13F | Simplex Trading, Llc | Put | 532.400 | 350,04 | 9.487 | 948.600,00 | |||
| 2026-02-12 | 13F | Renaissance Technologies Llc | 0 | -100,00 | 0 | |||||
| 2026-02-17 | 13F | Laird Norton Trust Company, Llc | 303.240 | 5.404 | ||||||
| 2026-02-05 | 13F | Bank Julius Baer & Co. Ltd, Zurich | 3.599.056 | 36,99 | 64.428 | 50,73 | ||||
| 2026-02-11 | 13F | Simplex Trading, Llc | Call | 190.300 | -38,93 | 3.391 | 67.720,00 | |||
| 2026-02-13 | 13F | Transamerica Financial Advisors, Inc. | 0 | -100,00 | 0 | |||||
| 2026-04-23 | 13F | Lansforsakringar Fondforvaltning AB (publ) | 0 | -100,00 | 0 | |||||
| 2025-11-06 | 13F | Financial Advocates Investment Management | 0 | -100,00 | 0 | |||||
| 2026-02-17 | 13F | Wiley Bros.-aintree Capital, Llc | 74.147 | 4,23 | 1.323 | 14,16 | ||||
| 2025-11-14 | 13F | Two Sigma Investments, Lp | 0 | -100,00 | 0 | |||||
| 2026-02-13 | 13F | Natixis | 55.975 | 24,46 | 997 | 36,39 | ||||
| 2025-10-30 | 13F | Ridgewood Investments LLC | 0 | -100,00 | 0 | |||||
| 2026-01-15 | 13F | Boston Common Asset Management, LLC | 643.224 | 64,14 | 11.462 | 79,80 | ||||
| 2026-01-21 | 13F/A | Euro Pacific Asset Management, LLC | 66.959 | 1,69 | 1 | 0,00 | ||||
| 2026-02-17 | 13F | Parvin Asset Management, LLC | 0 | -100,00 | 0 | |||||
| 2026-04-20 | 13F | Naples Global Advisors, Llc | 434.119 | 1,50 | 5.865 | -23,05 | ||||
| 2026-01-27 | 13F | Zurcher Kantonalbank (Zurich Cantonalbank) | 144.864 | 2.581 | ||||||
| 2026-04-22 | 13F | Union Bancaire Privee, UBP SA | 220.094 | 45,02 | 2.602 | 3,34 | ||||
| 2026-02-13 | 13F | Wells Fargo & Company/mn | 433.975 | 20,52 | 7.733 | 32,01 | ||||
| 2026-02-19 | 13F | Atomi Financial Group, Inc. | 41.531 | 49,03 | 740 | 63,36 | ||||
| 2026-02-10 | 13F | Godfrey Financial Associates, Inc. | 2.400 | 43 | ||||||
| 2026-01-08 | 13F | Nordea Investment Management Ab | 2.264.731 | -7,13 | 40.675 | 2,07 | ||||
| 2026-02-12 | 13F/A | Pinebridge Investments Llc | 246.000 | 4.384 | ||||||
| 2026-04-15 | 13F | Generali Investments CEE, investicni spolecnost, a.s. | 383.786 | 32,38 | 5.185 | 0,35 | ||||
| 2026-02-13 | 13F | Ariel Investments, Llc | 0 | -100,00 | 0 | |||||
| 2026-02-02 | 13F | Montag A & Associates Inc | 3.400 | 0,00 | 61 | 9,09 | ||||
| 2026-02-17 | 13F | FIL Ltd | 5.848.648 | -22,51 | 104.223 | -15,13 | ||||
| 2025-11-12 | 13F | Waverton Investment Management Ltd | 0 | -100,00 | 0 | |||||
| 2026-02-05 | 13F | Atria Investments Llc | 52.318 | 4,82 | 932 | 14,78 | ||||
| 2026-02-13 | 13F | Ieq Capital, Llc | 94.433 | 7,22 | 1.683 | 17,46 | ||||
| 2026-01-30 | 13F | Activest Wealth Management | 0 | -100,00 | 0 | |||||
| 2026-02-17 | 13F | Cetera Investment Advisers | 85.517 | -20,12 | 1.524 | -12,52 | ||||
| 2026-02-13 | 13F | State Street Corp | 14.953.842 | -9,10 | 266.477 | -0,44 | ||||
| 2026-02-12 | 13F | Steward Partners Investment Advisory, Llc | 6.675 | 26,90 | 119 | 38,82 | ||||
| 2026-02-17 | 13F | Captrust Financial Advisors | 18.630 | -0,84 | 332 | 8,52 |